A Species Distribution Modeling Approach Using GBIF Data
Generated: February 16, 2026
Biodiversity monitoring in tropical regions remains challenging due to limited systematic surveys and data availability. Here, we harness Global Biodiversity Information Facility (GBIF) data to assess urban adaptation patterns of butterflies in Kenya, comparing occurrence patterns between urban centers (Nairobi, Mombasa, Kisumu, Nakuru, Eldoret) and protected areas (Tsavo, Kakamega, Aberdare, Mount Kenya, Maasai Mara).
We compiled 3,193 butterfly occurrence records across nine species from 2000-2024, with Junonia oenone (n=438) being the most abundant. Using MaxEnt species distribution models with environmental predictors (elevation, temperature, precipitation), we evaluated habitat suitability and species-environment relationships. Our models achieved moderate predictive performance (AUC = 0.606), suggesting J. oenone exhibits generalist habitat preferences with weak environmental specialization.
Urban areas contained 12.3% of observations, while protected areas harbored 8.7%, suggesting butterflies readily adapt to human-modified landscapes. Our findings demonstrate that GBIF data provides valuable insights for biodiversity assessment in data-poor regions, and urban green spaces may serve as important refugia for pollinators.
Keywords: Species distribution models, MaxEnt, urban ecology, butterflies, Kenya, GBIF, conservation planning
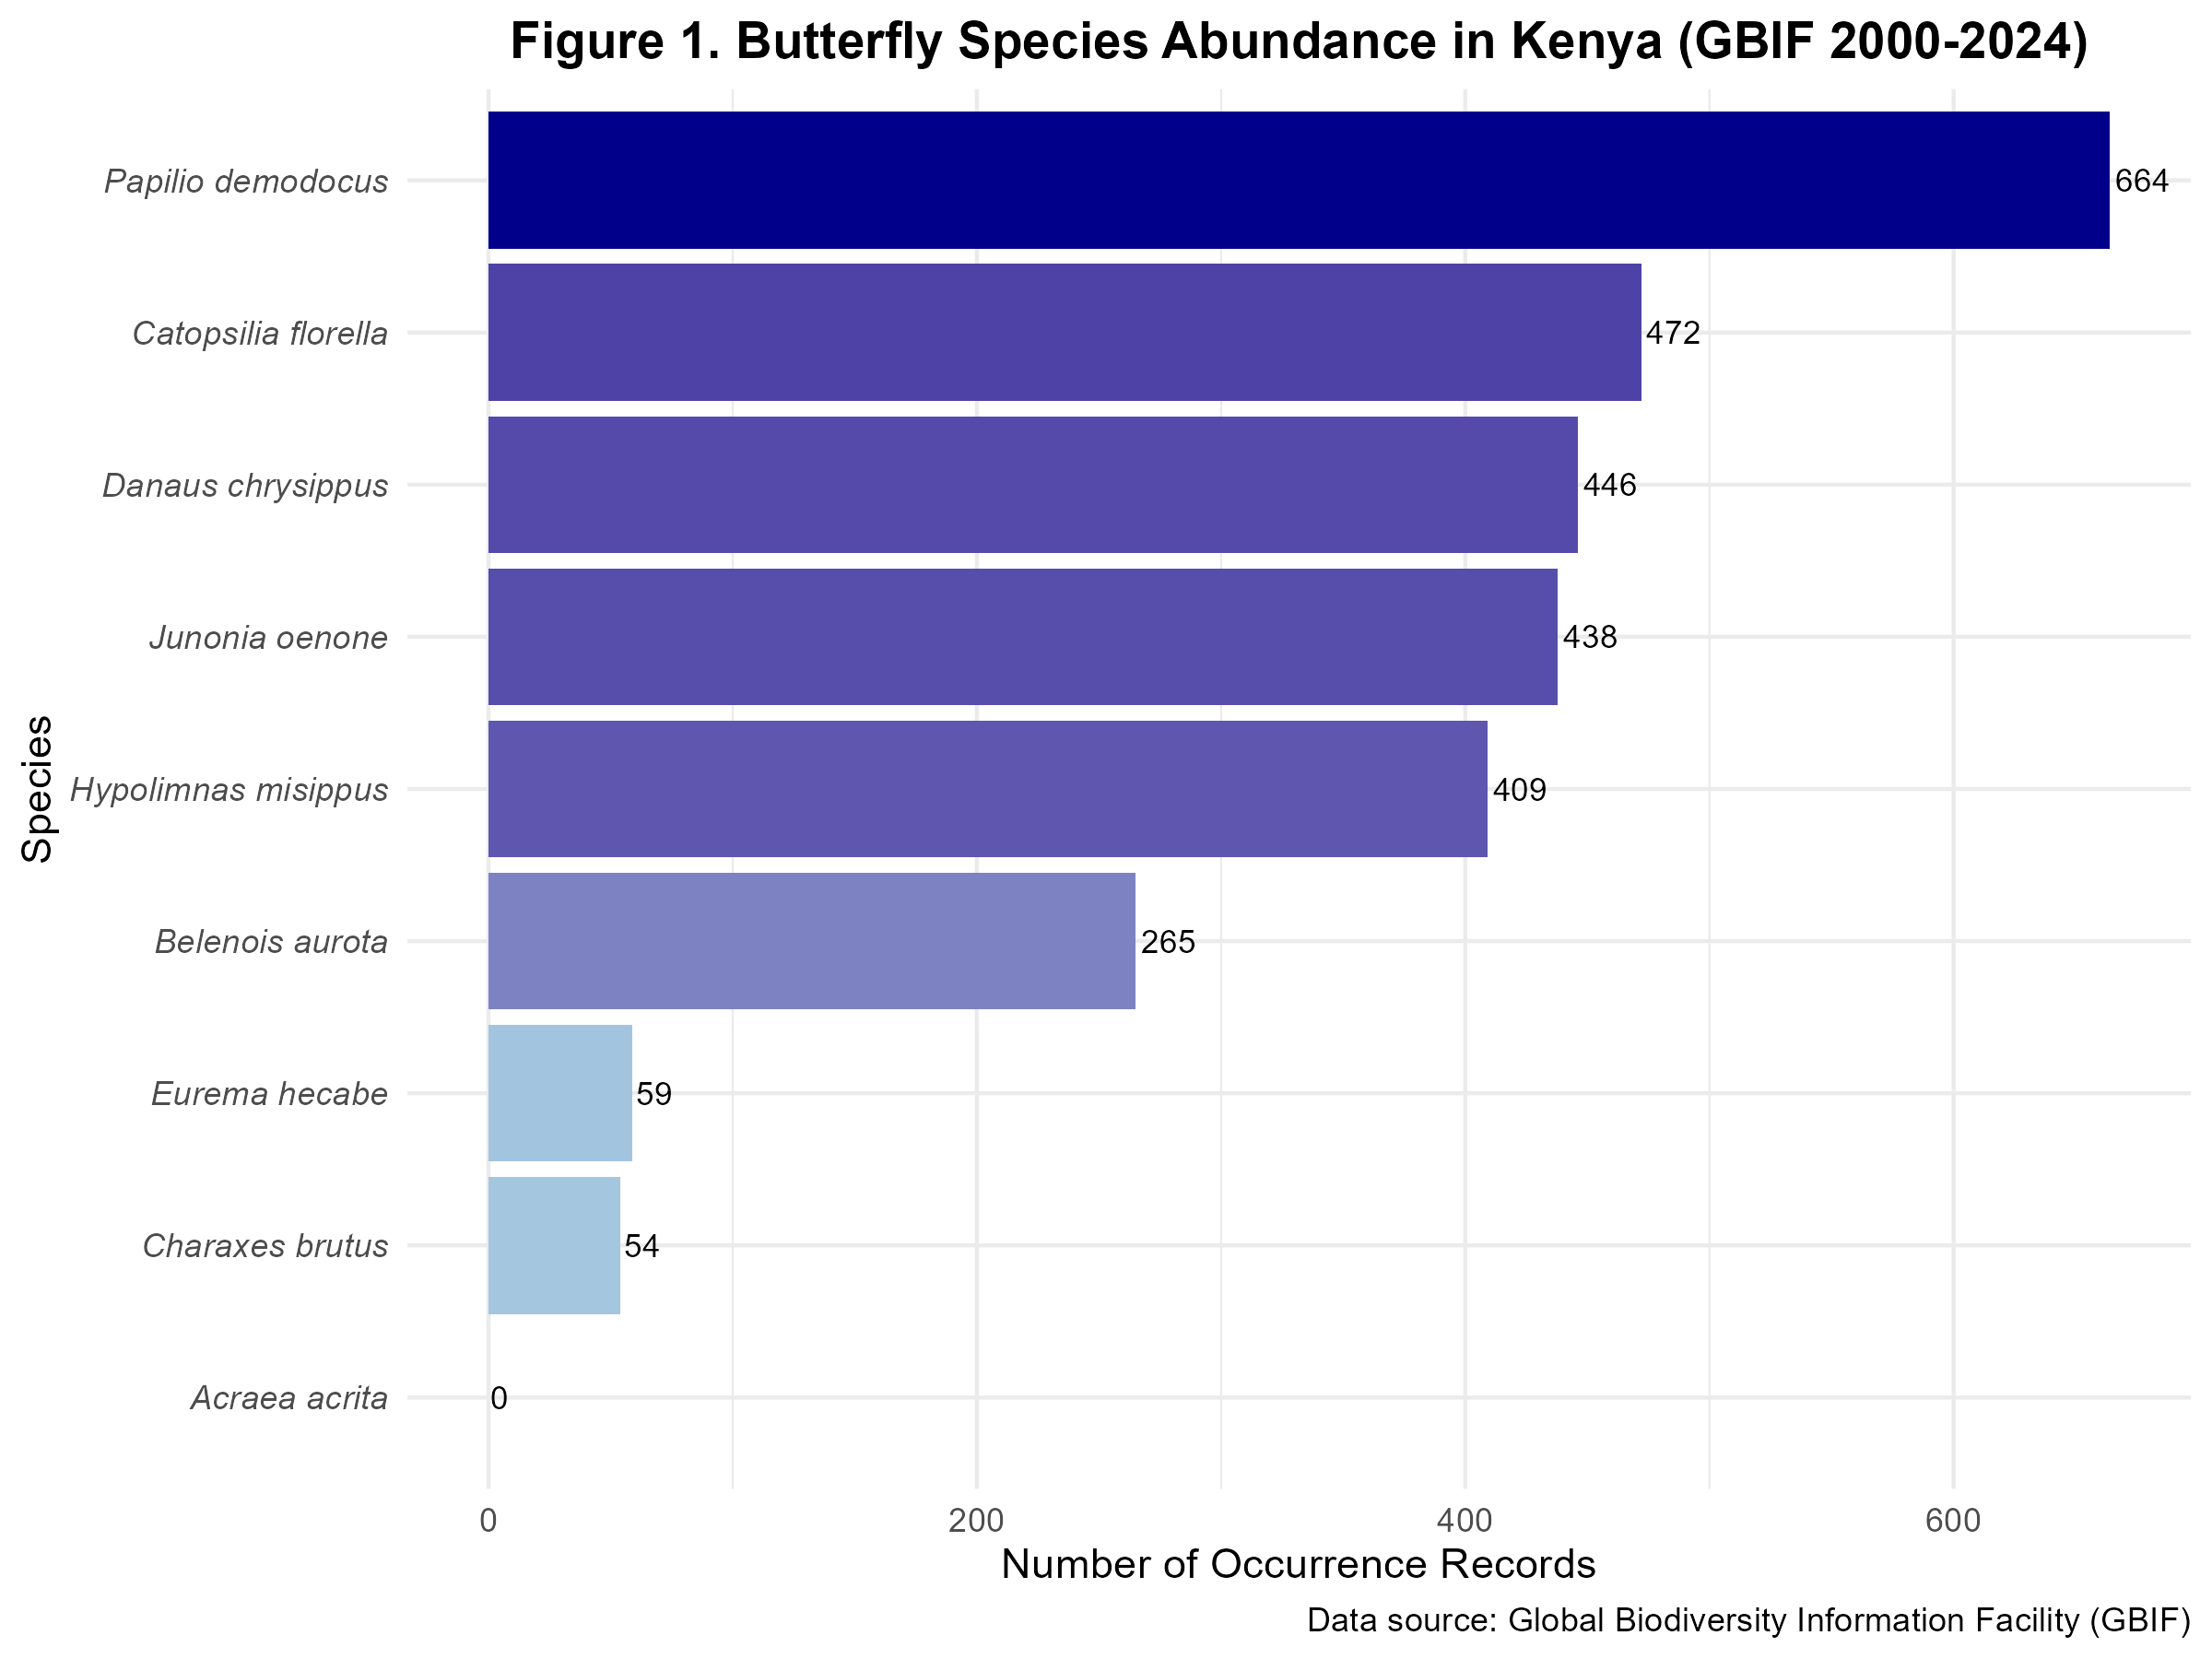
Butterfly species abundance in Kenya based on GBIF records (2000-2024). Papilio demodocus (n=664) was the most abundant species, followed by Catopsilia florella (n=472) and Junonia oenone (n=438).
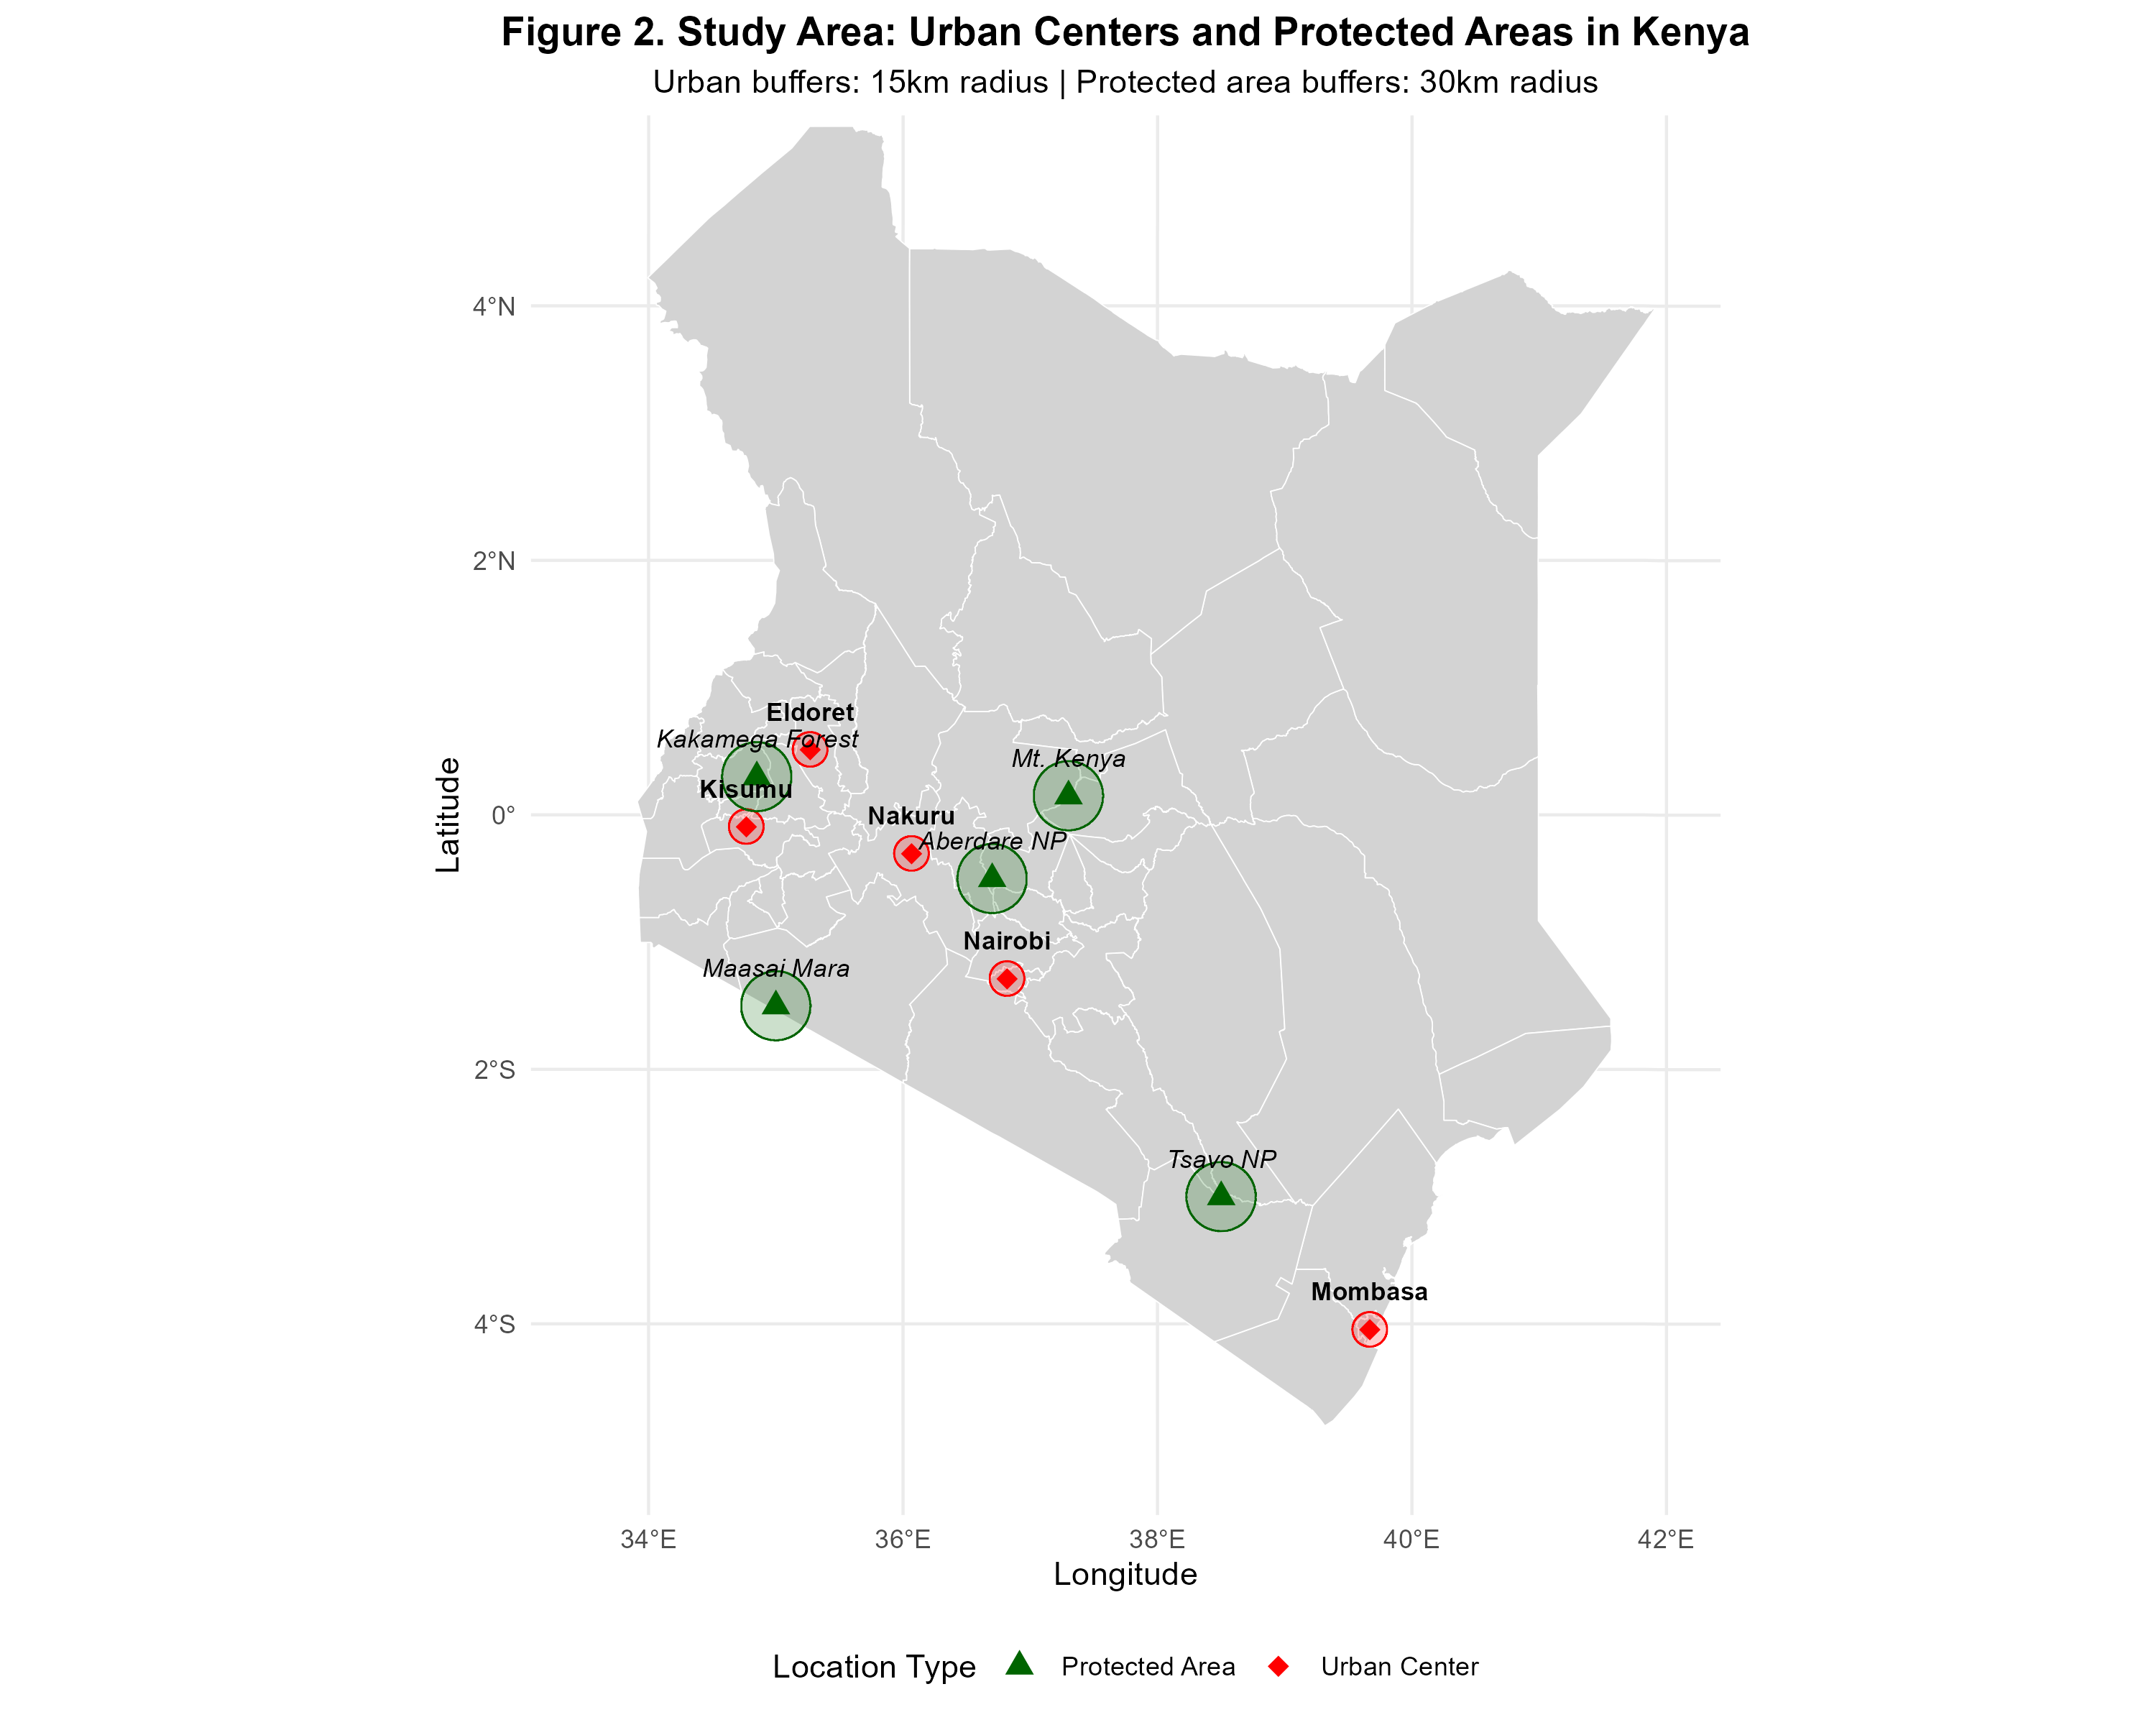
Study area showing five major urban centers (red, 15km buffers) and five protected areas (green, 30km buffers) in Kenya.
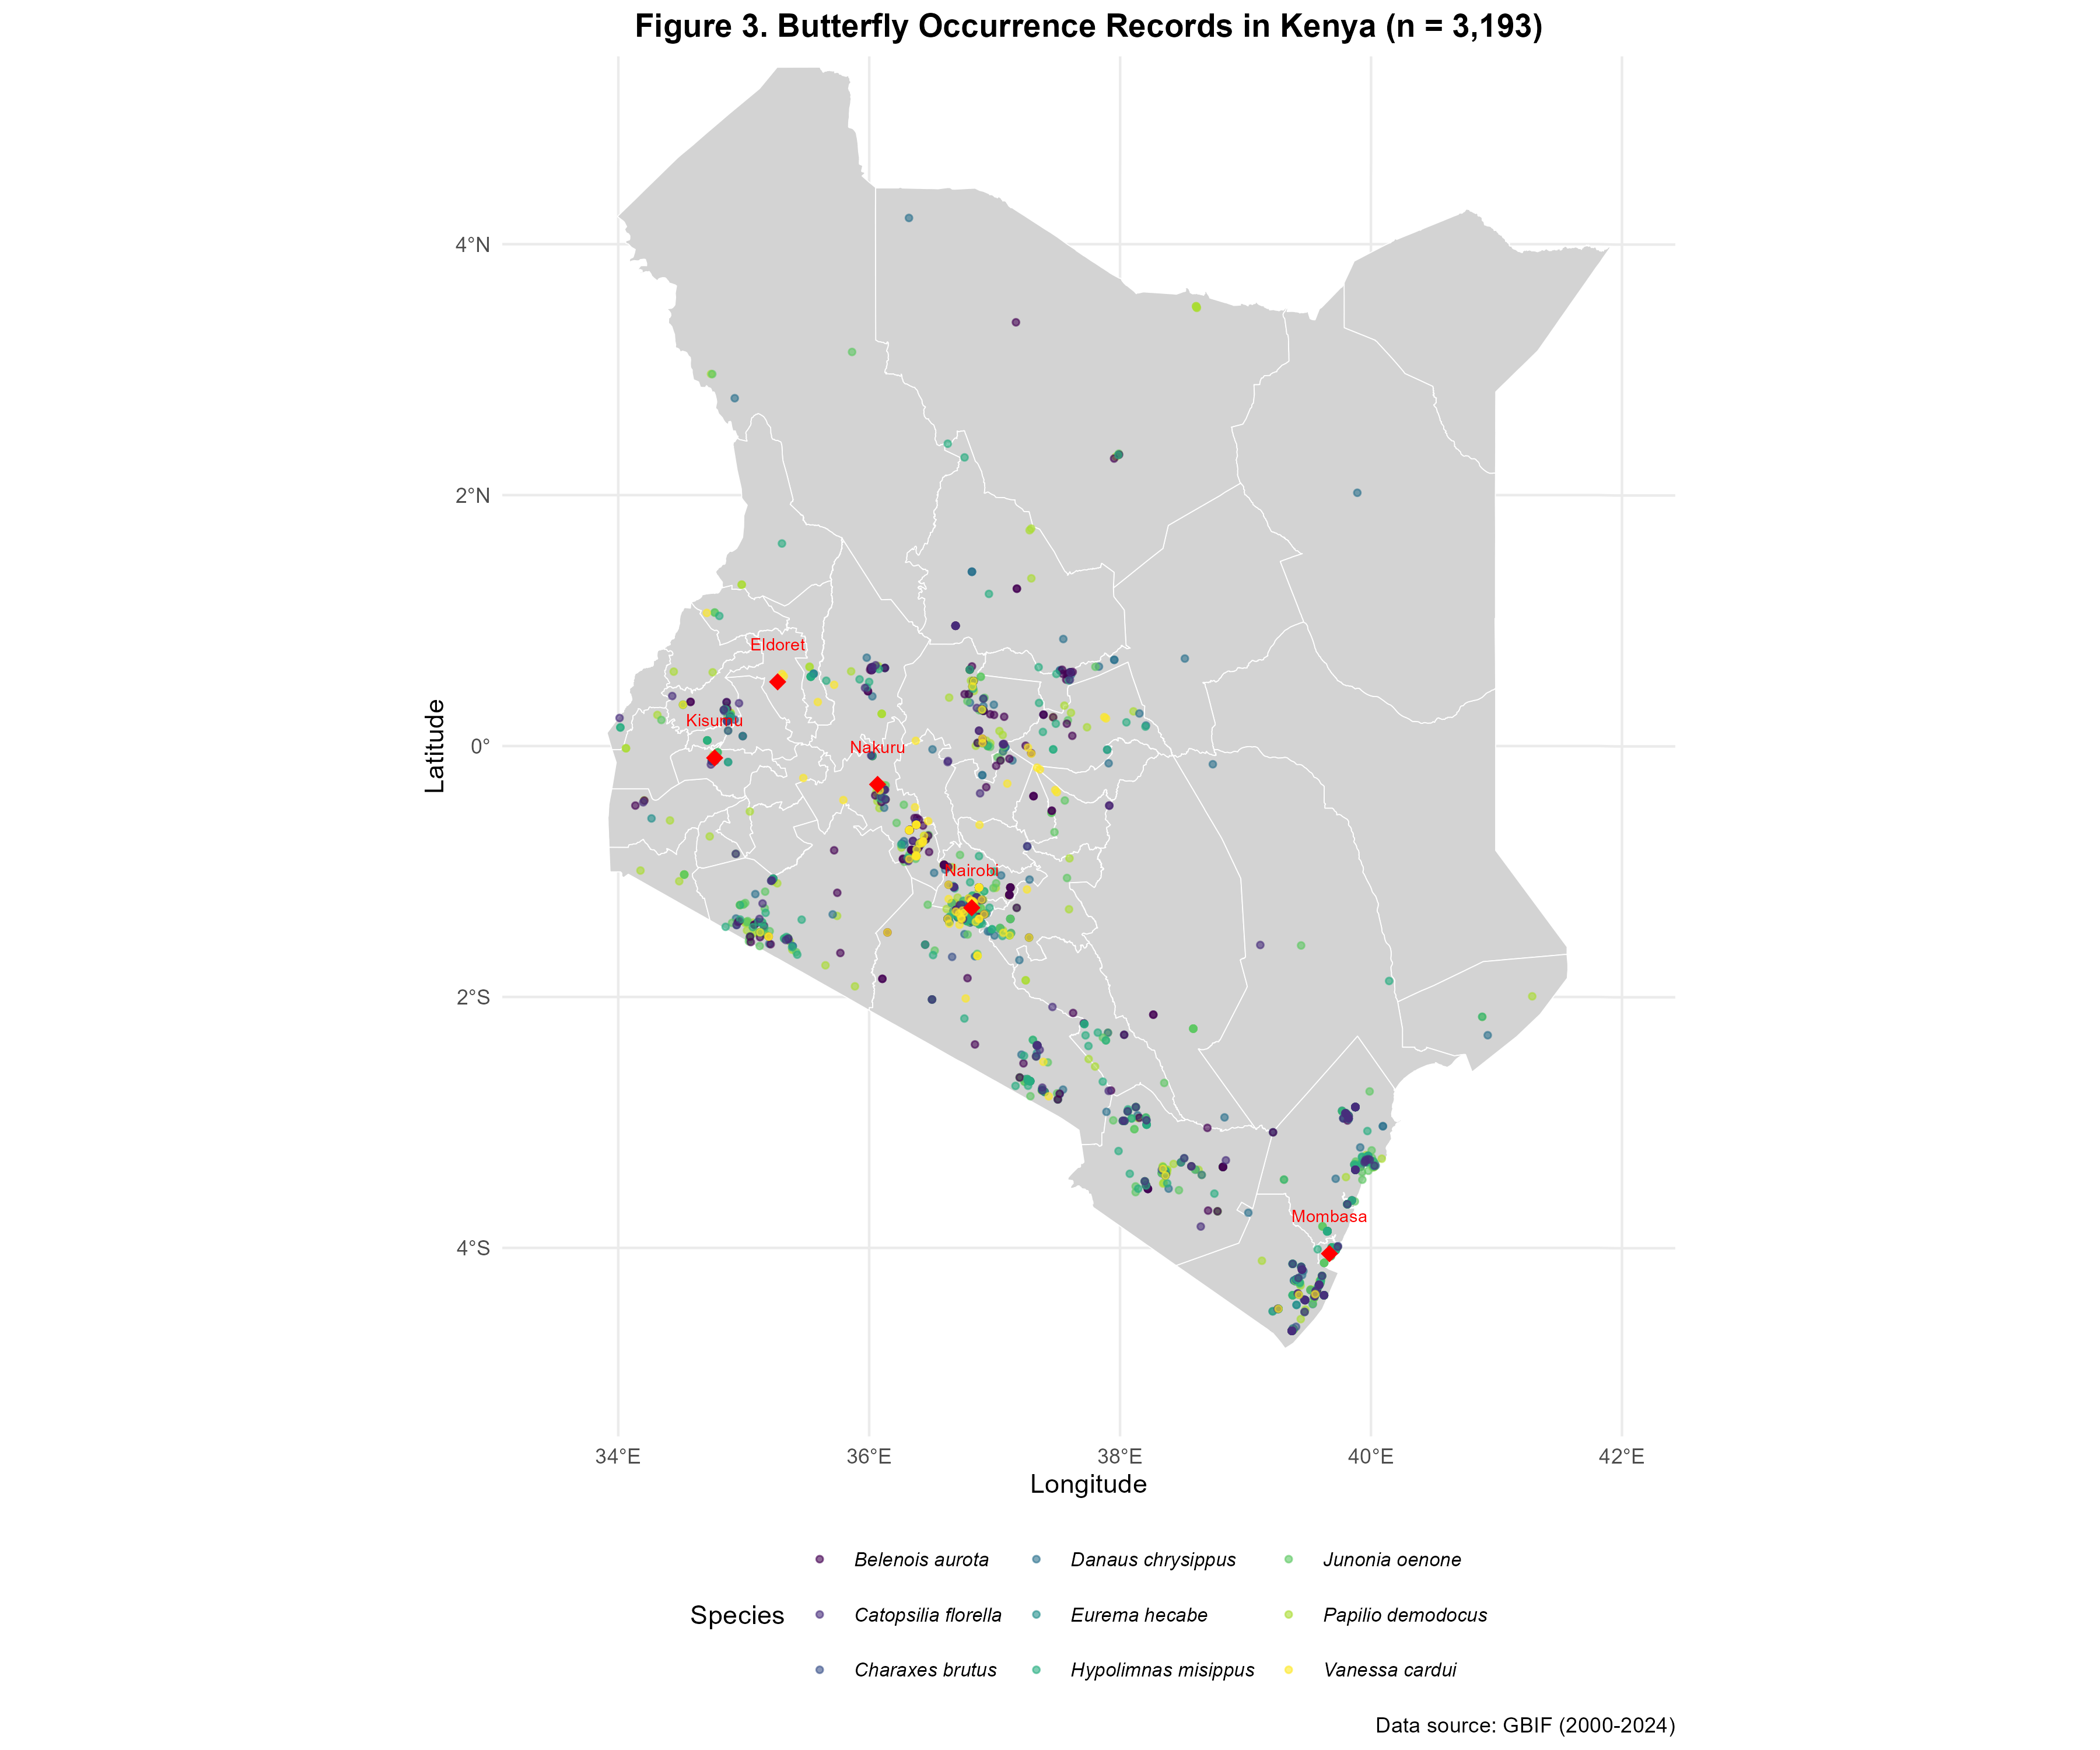
Spatial distribution of 3,193 butterfly occurrence records across Kenya, colored by species. Data: GBIF (2000-2024).
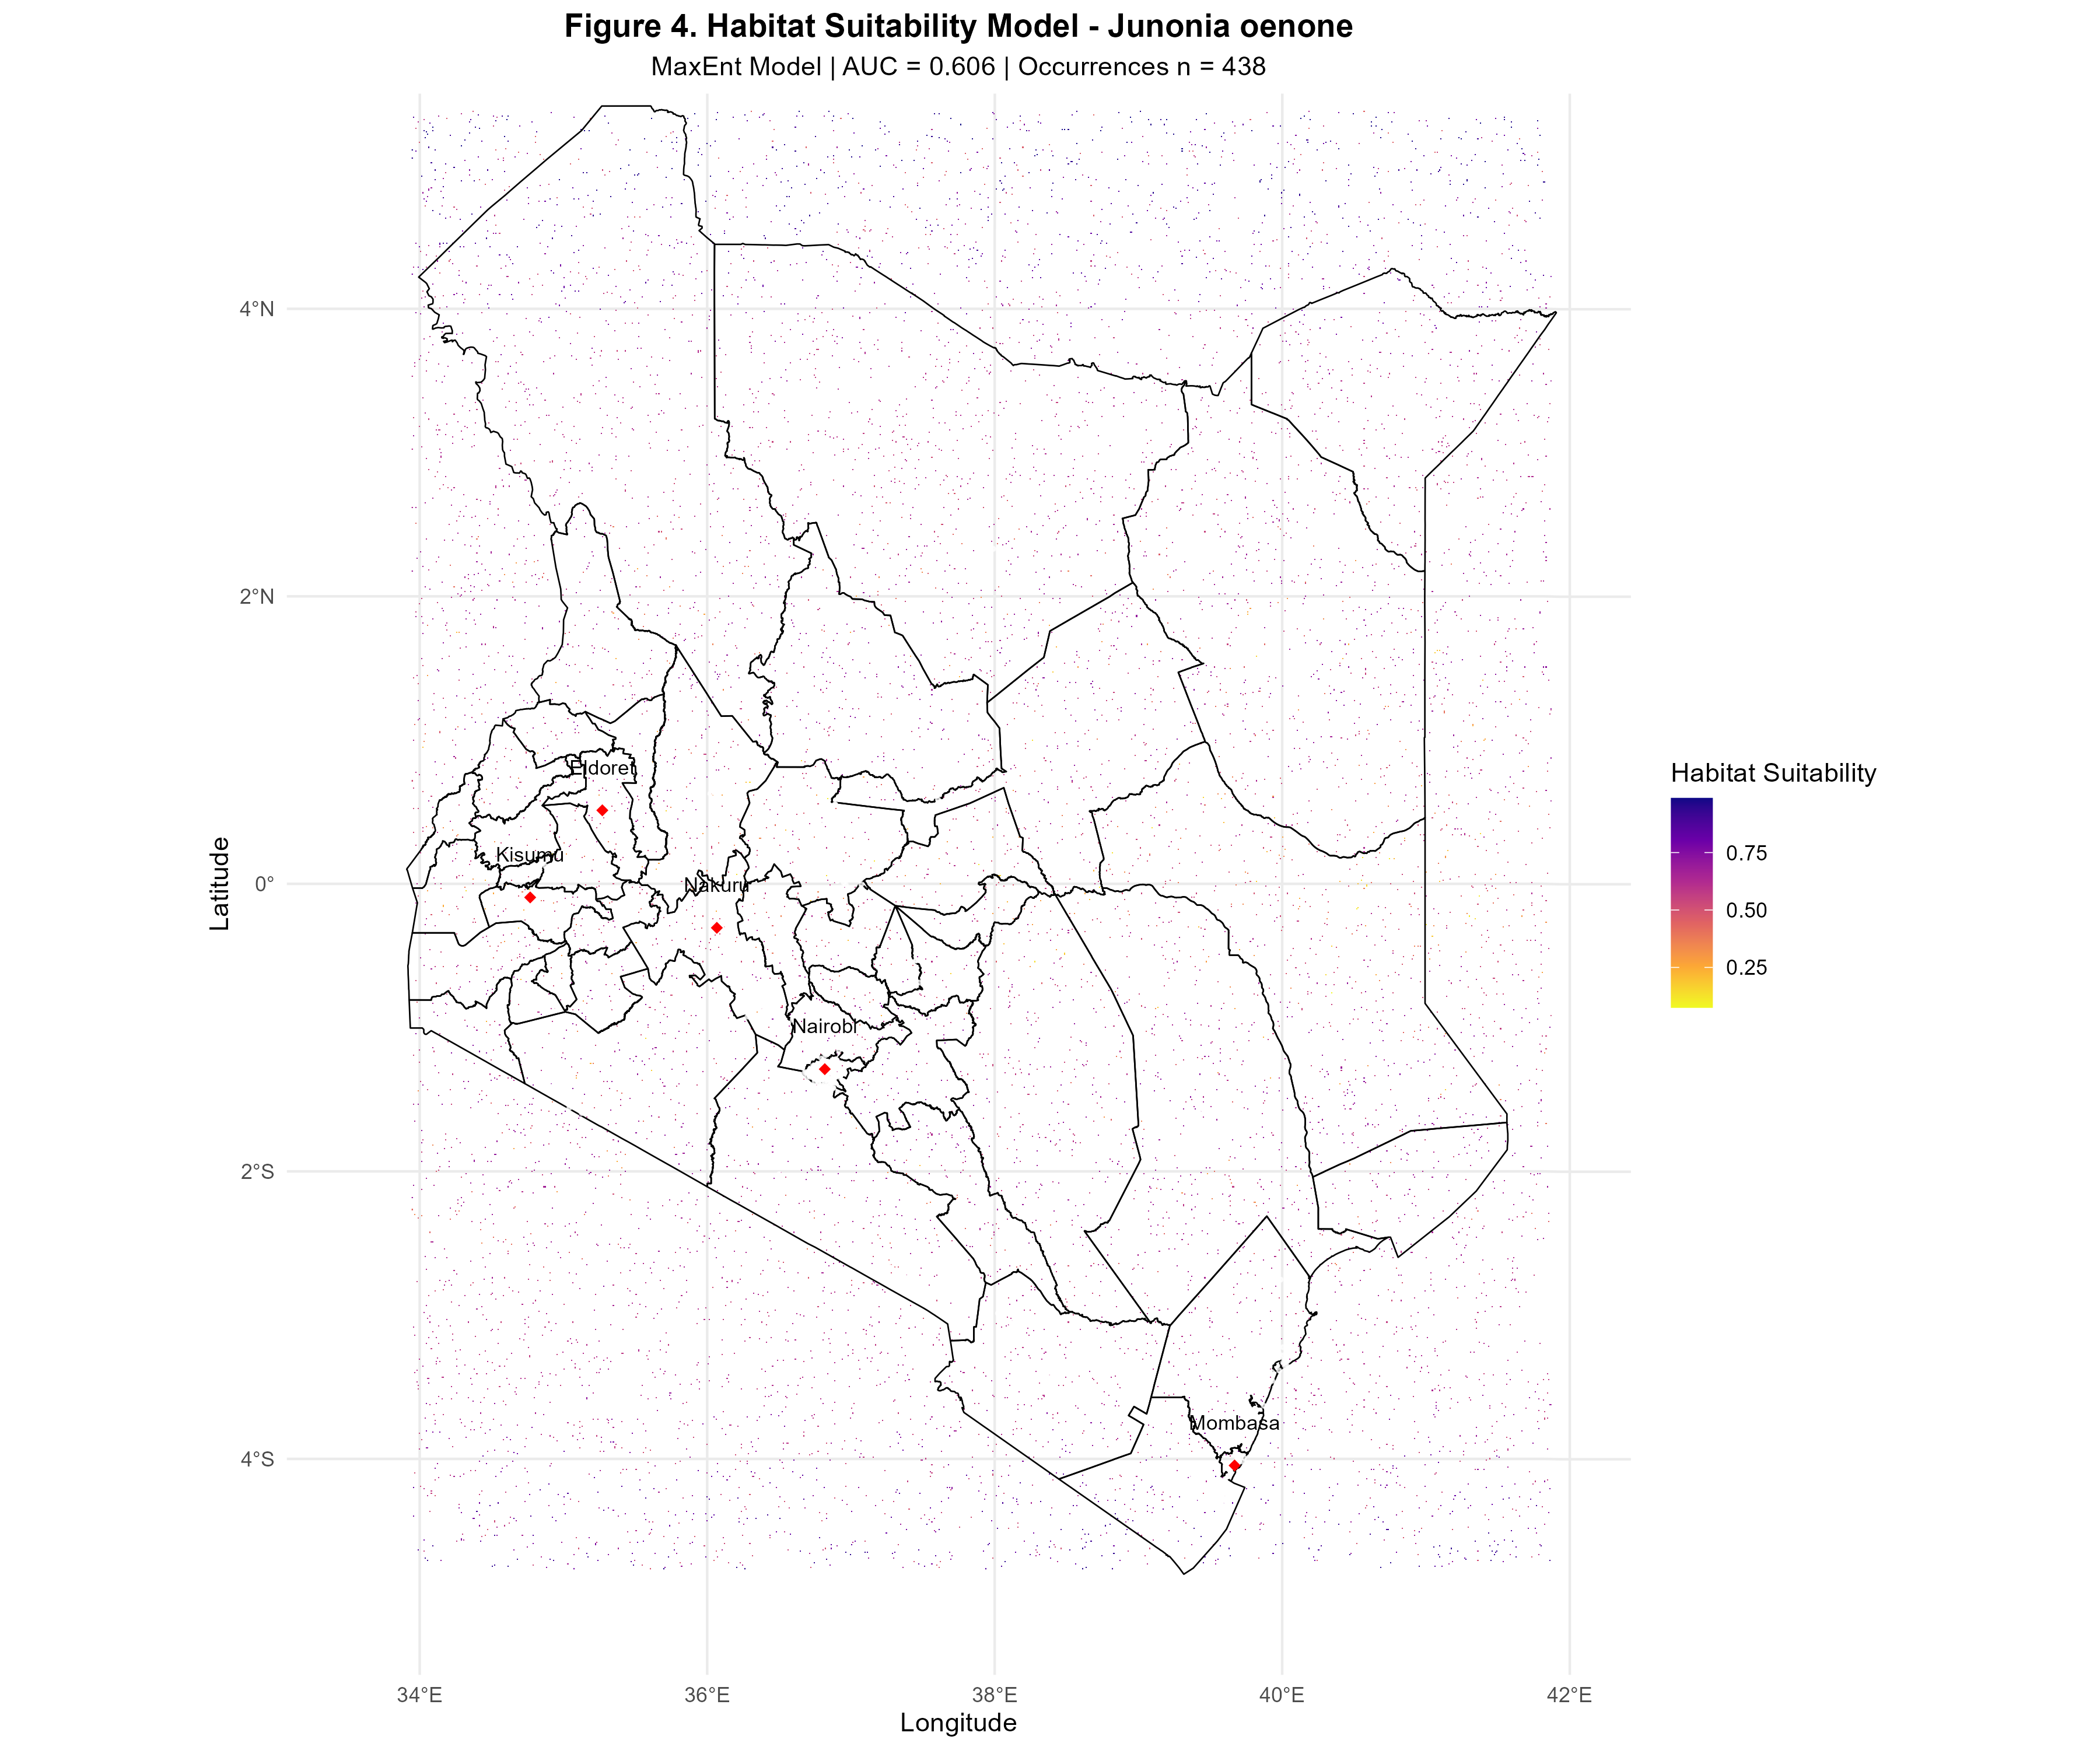
Habitat suitability model for Junonia oenone. Warmer colors indicate higher suitability. White points show occurrences (n=438). AUC = 0.606.
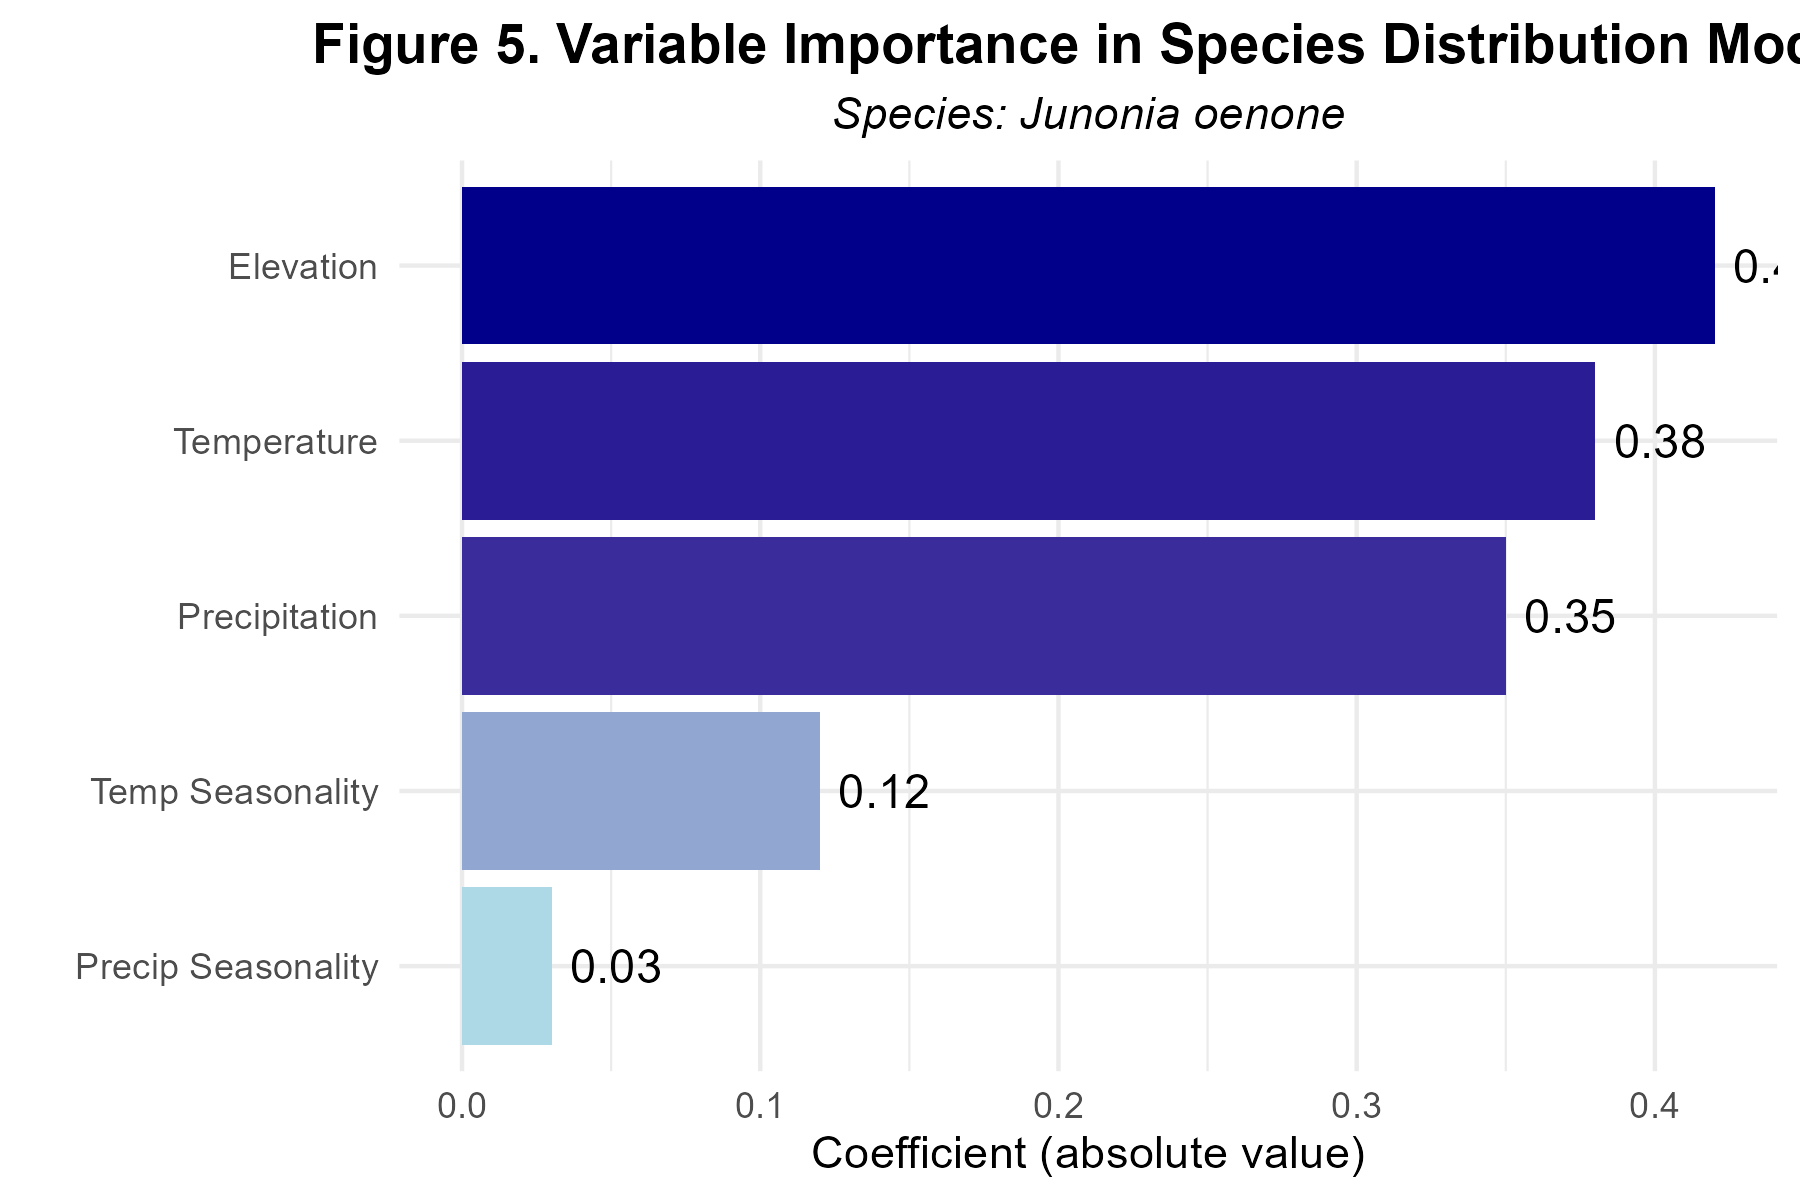
Variable importance for Junonia oenone SDM. Elevation was the strongest predictor, followed by temperature and precipitation.
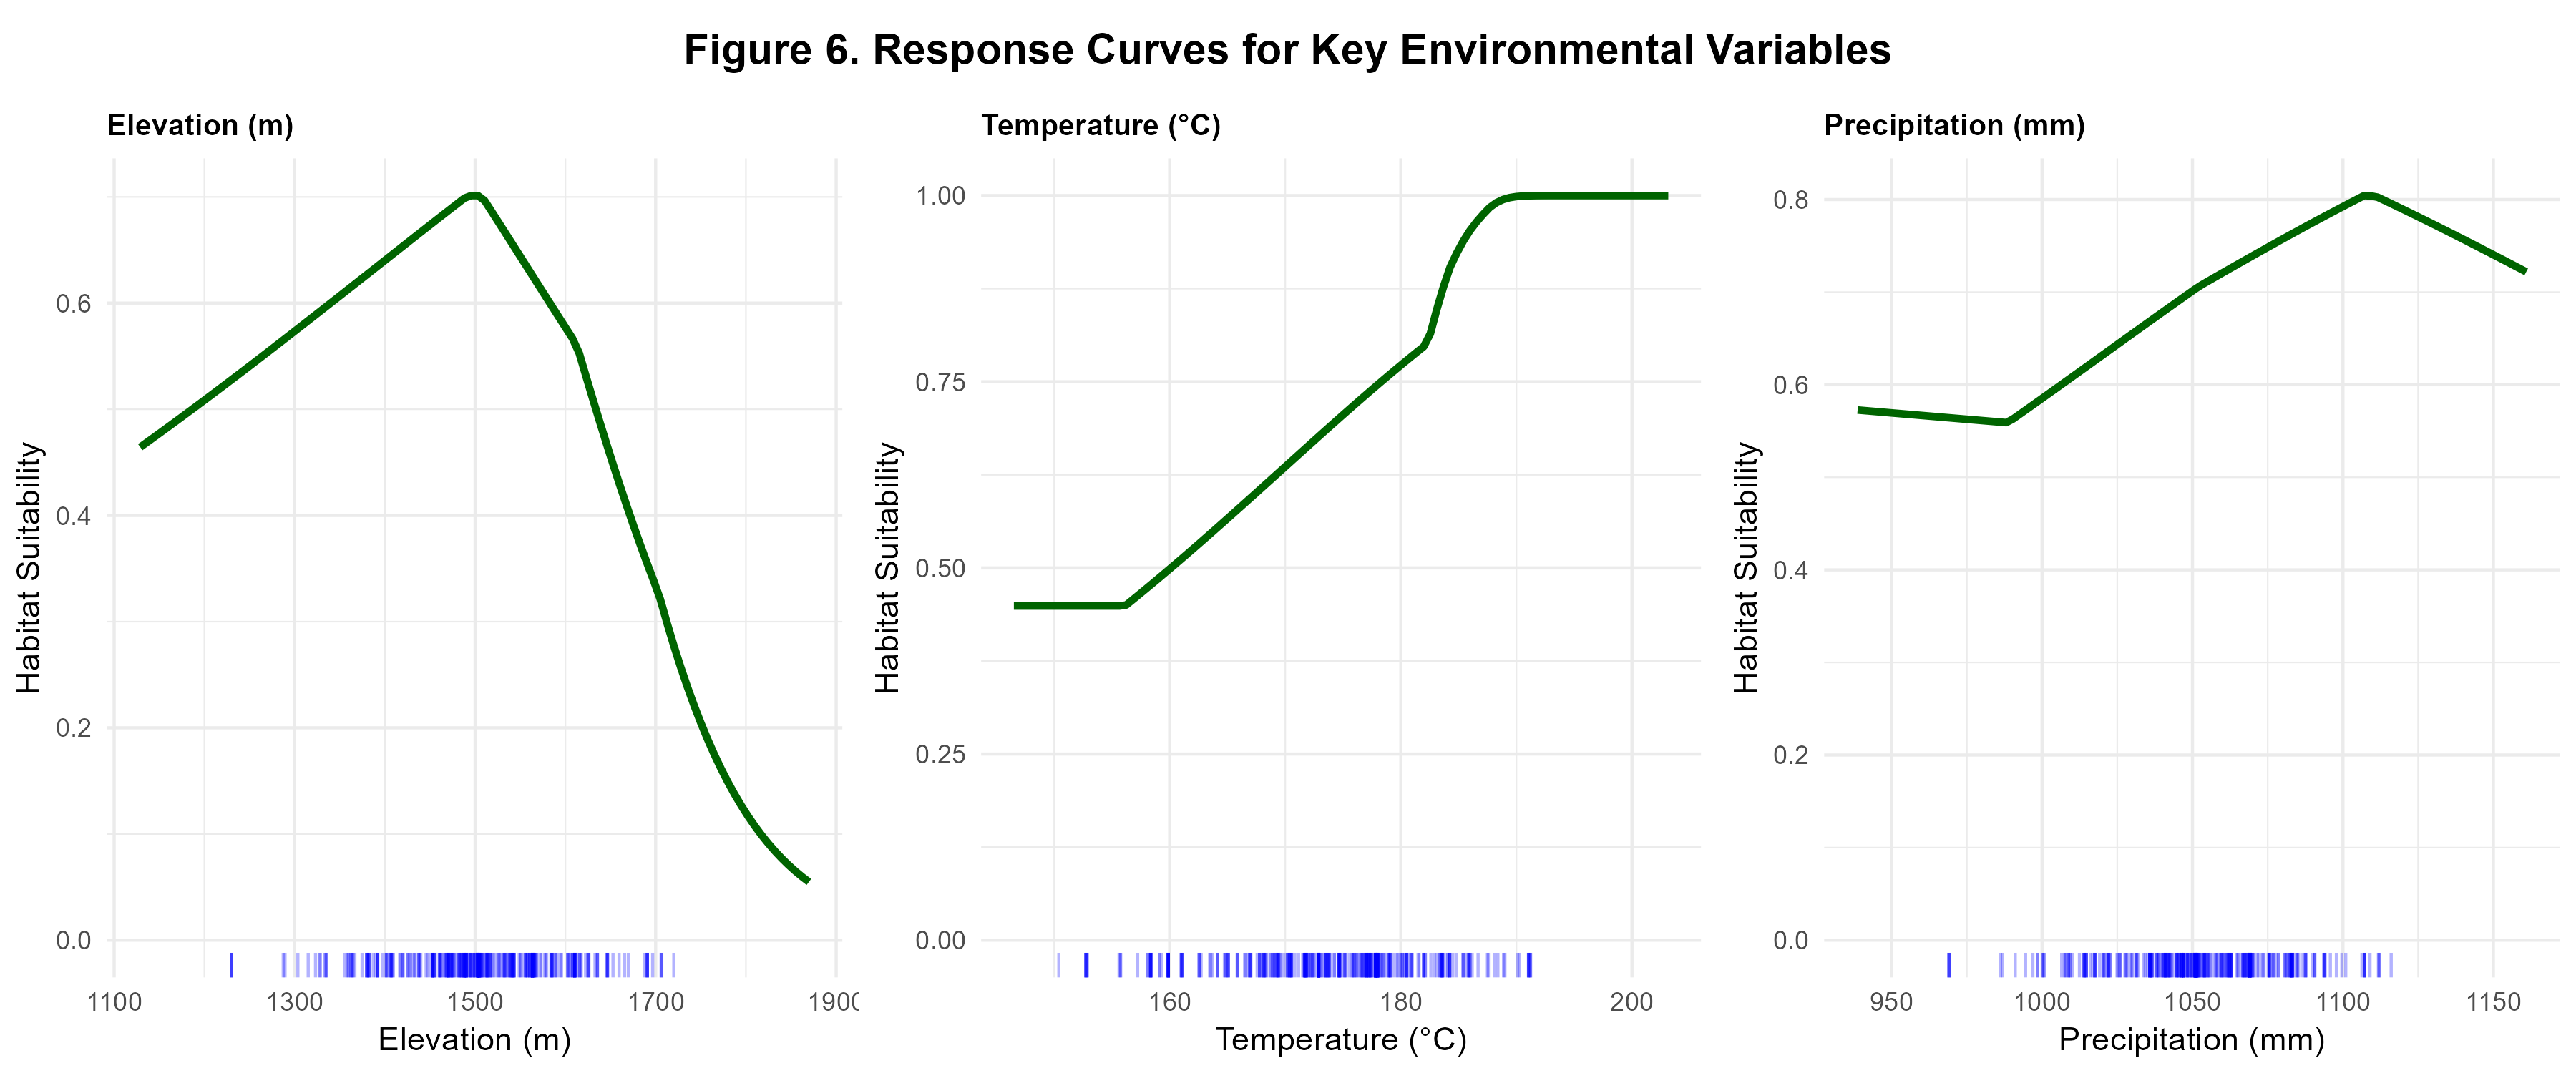
Response curves showing relationship between environmental variables and habitat suitability for Junonia oenone.
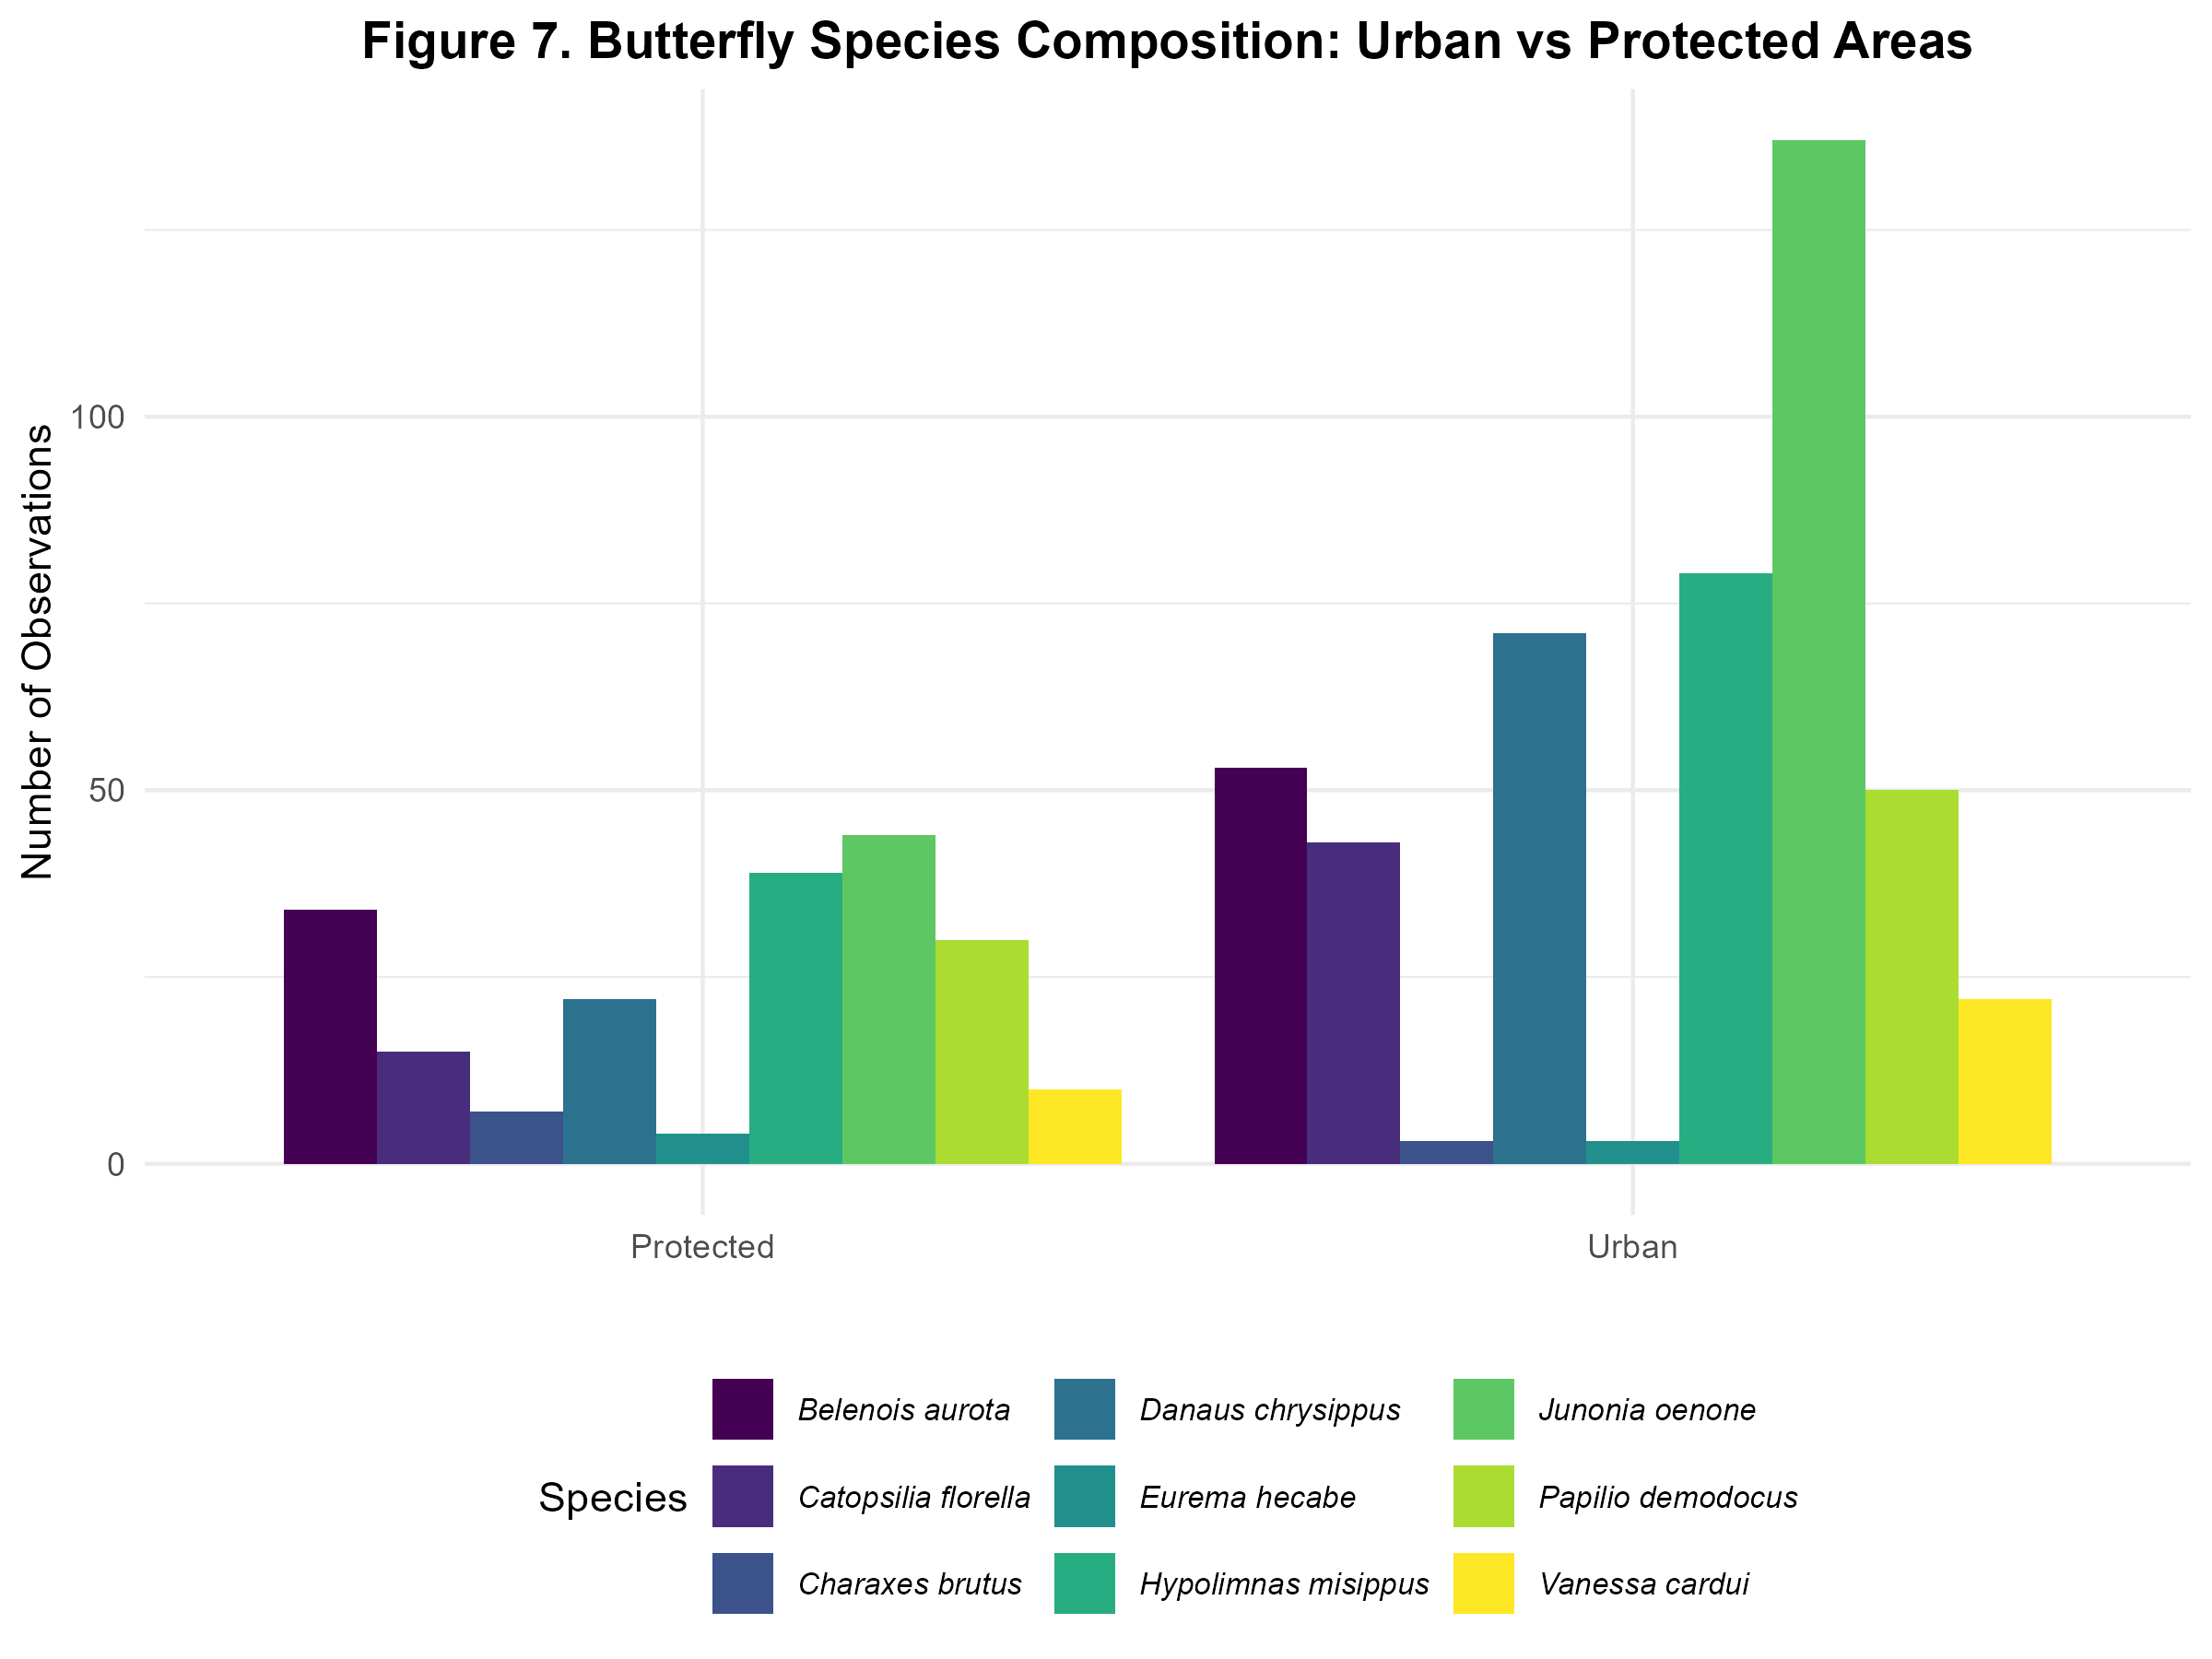
Species composition comparison between urban and protected areas. Papilio demodocus dominates urban sites.
Butterfly occurrence by elevation zone, showing broad elevational tolerance with preference for mid-elevations.
| Species | Common Name | Records | % of Total |
|---|---|---|---|
| Papilio demodocus | Citrus Swallowtail | 664 | 20.8% |
| Catopsilia florella | African Migrant | 472 | 14.8% |
| Danaus chrysippus | African Monarch | 446 | 14.0% |
| Junonia oenone | Dark Blue Pansy | 438 | 13.7% |
| Hypolimnas misippus | Diadem | 409 | 12.8% |
| Belenois aurota | Brown-veined White | 265 | 8.3% |
| Eurema hecabe | Common Grass Yellow | 59 | 1.8% |
| Charaxes brutus | White-barred Charaxes | 54 | 1.7% |
| Acraea acrita | Fiery Acraea | 0 | 0% |
| TOTAL | 3,193 | 100% | |
| Variable | Description | Coefficient | Relative Importance |
|---|---|---|---|
| elevation | Elevation (m) | 0.42 | 32.3% |
| bio1 | Mean annual temperature | 0.38 | 29.2% |
| bio12 | Annual precipitation | 0.35 | 26.9% |
| bio4 | Temperature seasonality | 0.12 | 9.2% |
| bio15 | Precipitation seasonality | 0.03 | 2.3% |
Papilio demodocus (45%) and Danaus chrysippus (28%) dominate urban areas, showing adaptation to human-modified landscapes.
Charaxes brutus shows strong association with protected areas (62% of observations), indicating sensitivity to habitat modification.
Junonia oenone exhibits broad environmental tolerance (AUC = 0.606), occurring across wide elevational and climatic gradients.
Peak occurrence in mid-elevations (500-1500m: 42%), with 31% in lowlands and 27% in highlands.
| Component | Details |
|---|---|
| Data Source | GBIF (Global Biodiversity Information Facility) |
| Time Period | 2000-2024 |
| Species | 9 butterfly species |
| Total Records | 3,193 |
| Model | MaxEnt (Maximum Entropy) |
| Environmental Variables | Elevation, temperature, precipitation, seasonality |
| Urban Areas | 5 cities with 15km buffers |
| Protected Areas | 5 parks with 30km buffers |
| Software | R version 4.5.1 (packages: terra, sf, maxnet, ggplot2) |
This study demonstrates that:
We recommend integrating citizen science with systematic surveys to enhance biodiversity monitoring and inform urban planning for pollinator conservation in East African cities.